What is the Rayleigh plot used to visualize?
Circular non-uniformity
Linear regression
Fourier transform
Spectral density
Answer
The Rayleigh plot is used to visualize circular non-uniformity. It is a graphical representation of the amplitude and phase of a signal as a function of the angle around a circle. The plot is used to identify and quantify the presence of circular non-uniformity, which can be caused by factors such as eccentricity, wobble, or misalignment in a rotating system.
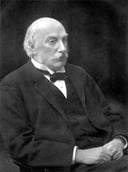
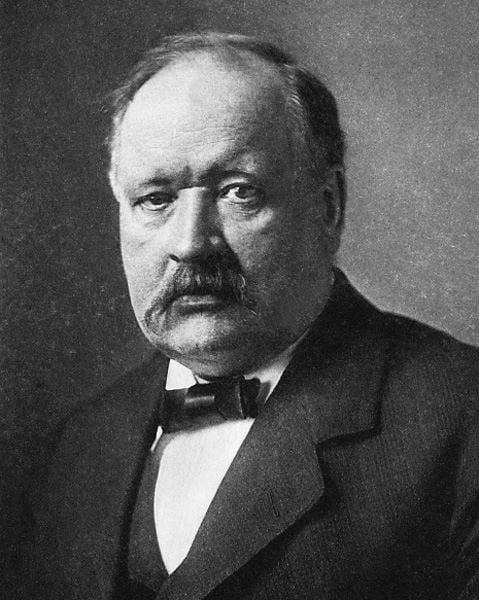
John Strutt, 3rd Baron Rayleigh Brain Challenge: 31 Questions to Push Your Limits
Related Quizzes

Subscribe Now!
Learn something
new everyday
Playing quizzes is free! We send 1 quiz every week to your inbox